


My Story

Berlin, Germany
Hi there, I'm Omid, a junior data analyst based in Berlin, Germany.
With years of experience in ESL training in corporate environments and academic research and editing, I bring a unique blend of analytical rigor and storytelling finesse to my work.
My interests lie in areas such as data visualization, predictive modeling, and machine learning, and I'm continuously expanding my technical toolkit with skills in Microsoft Excel, Tableau, SQL, and Python.
Outside of work, you'll find me cracking jokes, engaging in lively conversations, and connecting with others. I believe humor and warmth can really make connections, whether it's over coffee or at a virtual networking event.
I'm currently seeking opportunities to apply my skills, particularly in the fields of entertainment, tourism, travel, and hospitality, whether it's full-time, part-time, freelance, or remote work.
Let's connect and explore how we can work together to harness the power of data for meaningful outcomes!


Portfolio
GameCo


Influenza Season

Rockbuster Stealth


Instacart


World Happiness Report 2019


Objective
GameCo, a video game company, tasked me with conducting a descriptive analysis of a dataset to guide their development of new games and gain insights into their potential market performance.
Dataset
Toolkit
Excel served as the linchpin in my analytical toolkit throughout this analysis, playing a pivotal role in manipulating and visualizing the complexities of the historical video game sales data.


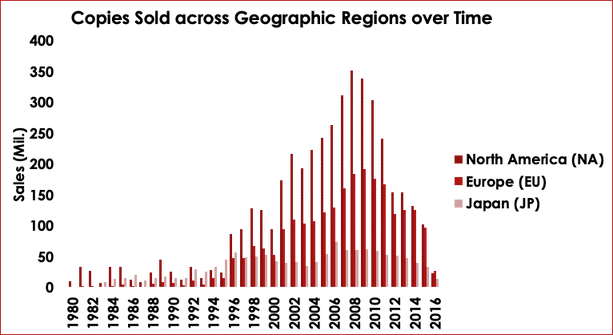
- These graphs revealed that
- North America was the leading market until 2015, despite the downward fluctuations in sales since the 1980 peak.
- Almost certainly due to the 2008 global financial crisis, North American sales began to decline in 2009.
- The same year, both the EU and Japan experienced growing trends. By 2015, the EU surpassed North America, capturing almost 40% of sales.
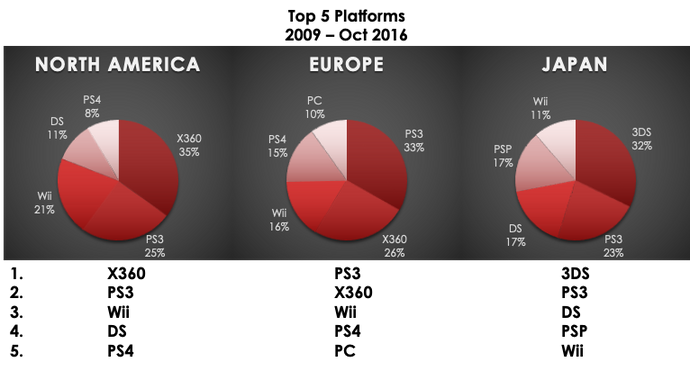
- North America:
- Xbox 360 (X360) and PlayStation 3 (PS3) lead the market.
- Wii remains relevant despite newer releases.
- Europe:
- PlayStation 3 (PS3) and Xbox 360 (X360) compete for the top spot.
- PC emerges in the top five, showcasing diverse choices.
- Japan:
- Nintendo 3DS dominates, highlighting a preference for handheld gaming.
- PlayStation Portable (PSP) remains popular.
- Nintendo Wii maintains a presence.


Conclusions
The popularity of video game genres has exhibited notable fluctuations since the 2010s, indicating potential shifts in the market landscape. Despite this, certain genres consistently maintain consumer interest across diverse regions, serving as a reliable foundation for strategic budget allocation.
Recommendations
For optimal market penetration, it is advised to prioritize efforts in Europe and North America, with a particular focus on the Action, Shooter, and Sports genres. These genres demonstrate the highest popularity, leaving untapped opportunities in other genres for publishers to explore and capitalize on. For further information, please see the PowerPoint Presentation below.
Limitations
It's important to note that the data lacks consideration for external influences, cultural nuances, or the specific impacts of individual games. This limitation may result in an oversimplified view of the market landscape, emphasizing the need for a nuanced approach in understanding the gaming industry dynamics.

Objective
I was tasked with assisting a medical staffing agency in supplying temporary personnel to clinics and hospitals based on their immediate requirements, particularly during seasonal surges in influenza cases in the US. The primary goal was to analyze influenza trends and use this information to proactively formulate staffing strategies on a national scale.
Dataset
1. Influenza deaths by geography
Source: CDC
2. Population data by geography, time, age, and gender
Source: US Census Bureau
Toolkit
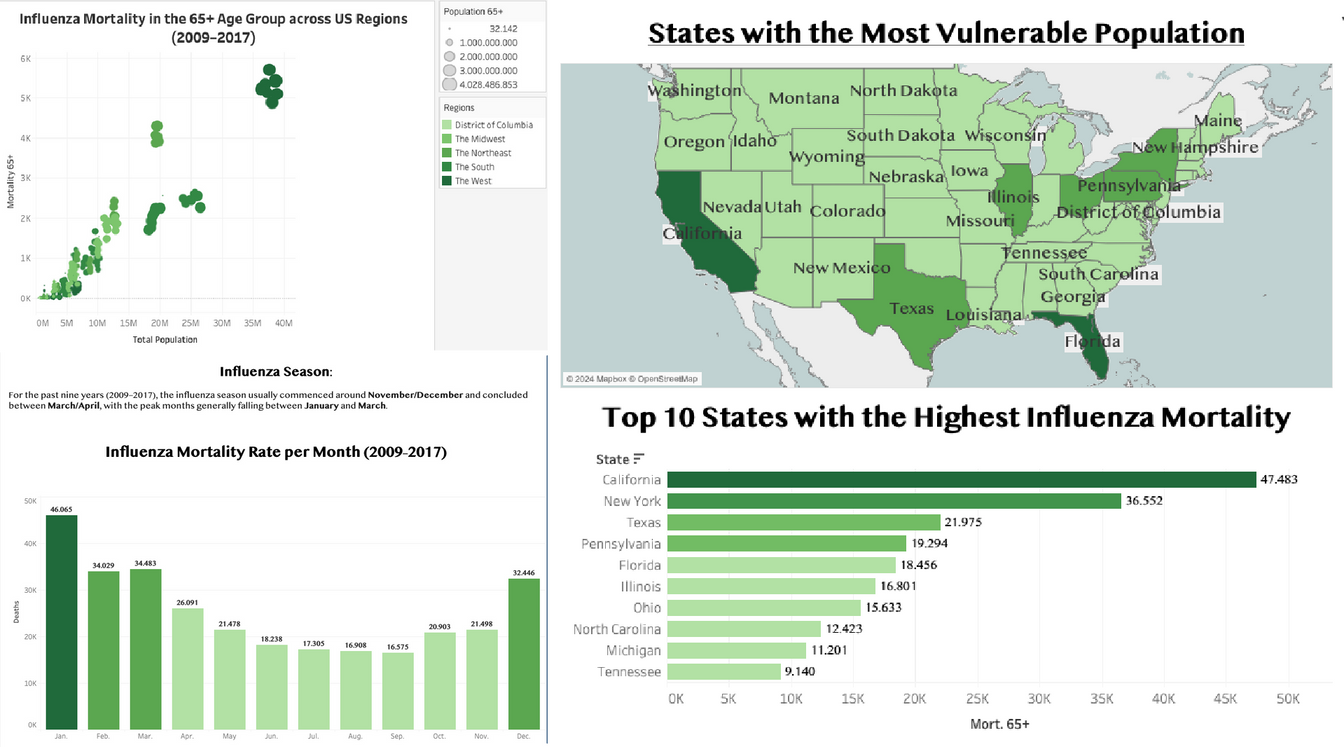
Besides Excel, I created an interactive dashboard with spatial analysis using Tableau. This included integrating scatter plots, heat maps, pie charts, and a composite map that includes choropleth and graduated components.
Conclusions
Throughout the Fall and Winter seasons, there is a noticeable upswing in influenza prevalence, characterized by heightened infection rates. Individuals aged 65 and above, in particular, confront a significantly elevated risk of mortality due to influenza-related complications during this timeframe.
Recommendations
Tailor staff placements according to the size of a state's vulnerable population and their assigned priority status. Leverage the provided Tableau dashboard below to ensure the maintenance of an appropriate staff-to-patient ratio.
Limitations
Challenges within the data, including inconsistencies and incompleteness across states, presented obstacles during the analysis phase. Identifying underreported mortality rates proved particularly demanding, relying solely on CDC data for verification, thereby introducing complexity into the process.

03 Rockbuster Stealth
Objective
As a data analyst at Rockbuster Stealth LLC's BI department, I contributed to the launch strategy of their online video service. This included addressing data queries, offering analytical support, and presenting insights to the Management Board.

Dataset
The dataset furnished by CareerFoundry contained information about Rockbuster’s film inventory, customers, and payments, among other things, which was loaded into the PostgreSQL database.
Toolkit
I used SQL queries with pgAdmin4 to clean and enhance the data, addressing issues like duplicates, non-uniform data, inaccuracies, and missing entries. Employing joins, I explored interconnections among tables for a nuanced understanding. Subqueries and CTEs provided insights into the behaviors of top customers.


Conclusions
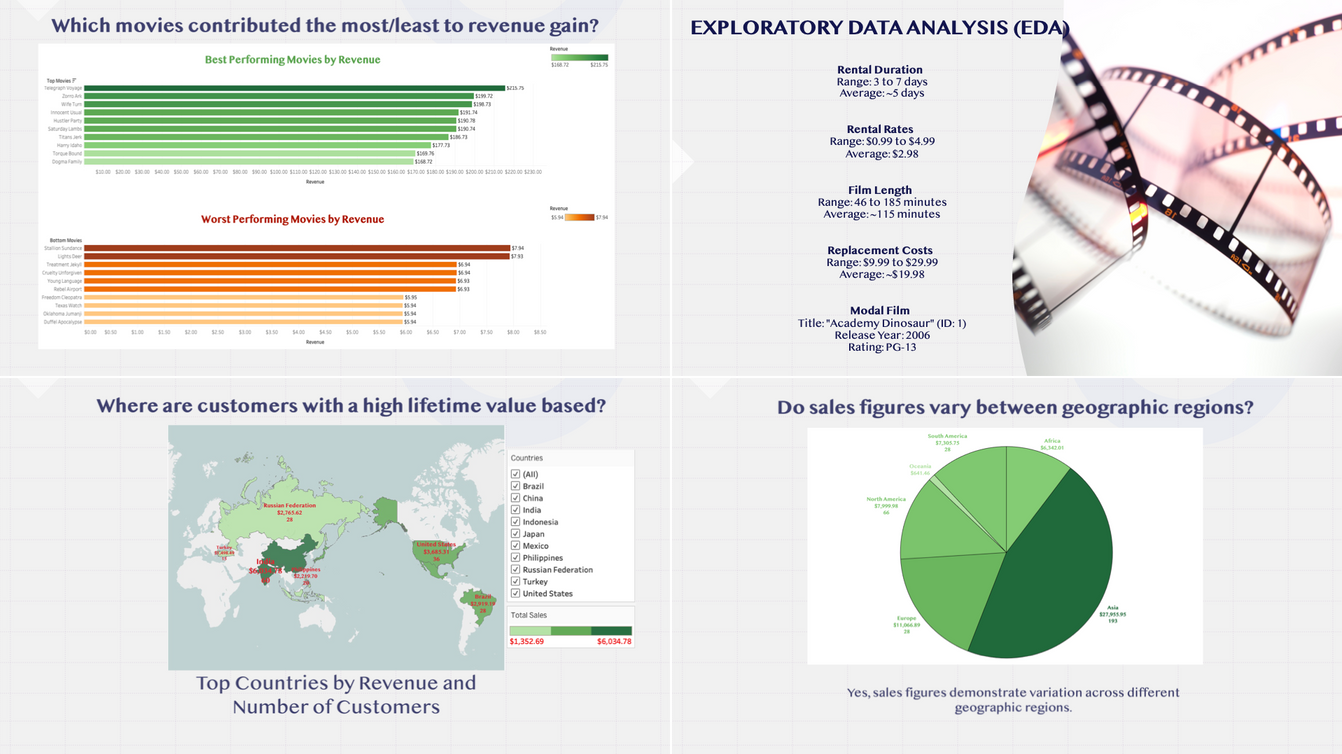
Focus marketing efforts on the top 10 countries with significant customer bases and revenue generation. Implement promotional strategies, like extended rental durations (e.g., rent for 4 days and receive the 5th day at no charge), to enhance engagement.
Recommendations
Expand the online platform globally for a broader audience.
Provide diverse viewing options and flexible pricing based on regional preferences. Optimize inventory management and pricing using replacement cost insights. Tailor inventory to meet regional demand, optimizing costs and profitability.
Limitations
The data's educational context may limit its representation of a comprehensive consumer base due to missing variables. Problem-solving techniques were used to optimize available data, acknowledge biases, and transparently communicate limitations. The aim was to extract valuable insights within set boundaries.


04 Instacart
Objective
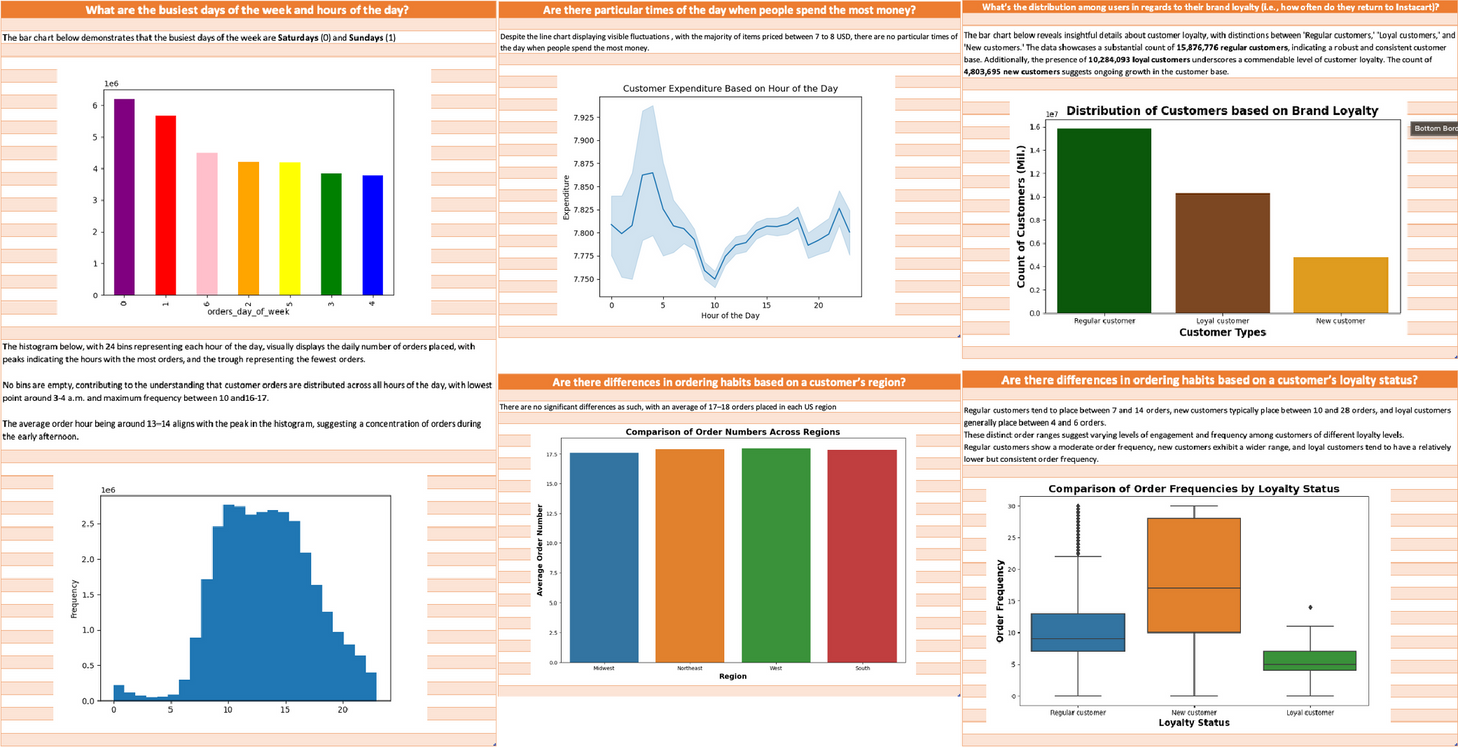
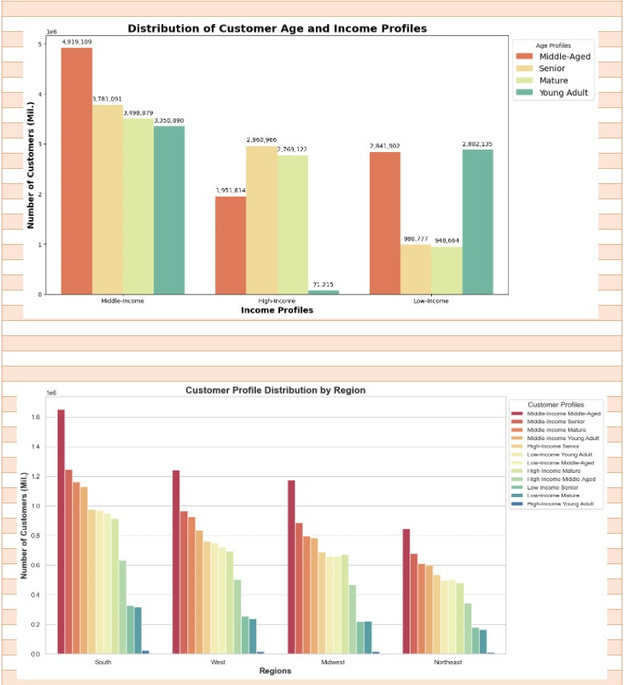
As an analyst for Instacart, an established online grocery store, I was tasked with conducting an initial data and exploratory analysis. The goal was to uncover additional insights into sales patterns and propose strategies for enhanced segmentation based on provided criteria.
Dataset
Customers’ data set for Instacart provided by CareerFoundry, comprised of demographic info such as user ID, gender, state, age, etc.
Data Dictionary via Kaggle.
Toolkit
To process data in Python, various data-wrangling techniques were employed, including dropping and renaming columns, adjusting data types, and transposing data. Mixed, missing, and duplicate values were identified and rectified. Finally, visualizations were created using Seaborn, Matplotlib, and Scipy libraries, and the findings were presented through Excel spreadsheets.

Recommendations
Ad Campaign Optimization: Focus ads on quieter days, such as Tuesdays and Wednesdays, especially during the evening and early morning.
Product Promotion Strategy: Prioritize promotions for produce and dairy eggs, the most popular categories. Consider secondary promotions for beverages, snacks, frozen, and pantry items.
Customer Loyalty Approach: Tailor engagement strategies based on customer loyalty insights. Focus on consistent service for regular customers, targeted promotions for loyal ones, and retention efforts for new customers.
Limitations
Temporal Scope: The analysis focuses on a specific timeframe, and conclusions may not capture potential variations in customer behavior over longer periods or during specific seasons.
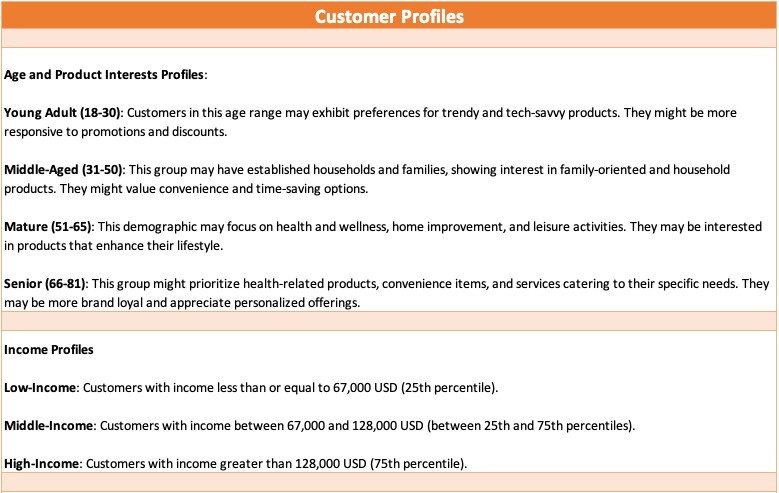
Demographic Details: The analysis lacks detailed demographic information, limiting the ability to tailor strategies based on factors like age, income, or specific regional preferences.
Sampling Bias: The datasets may not represent the entire customer base, potentially introducing sampling bias.

Objective
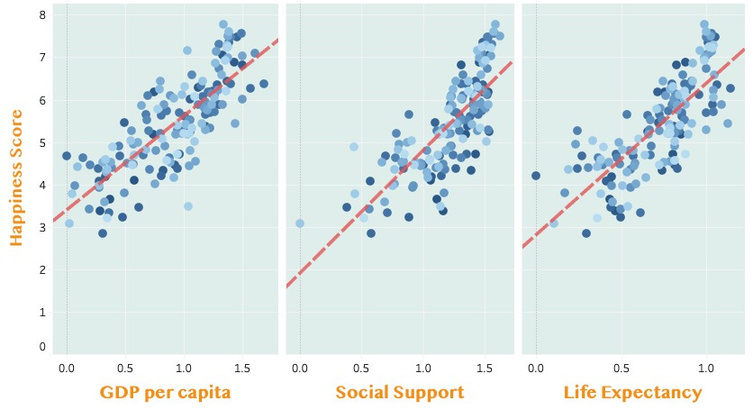
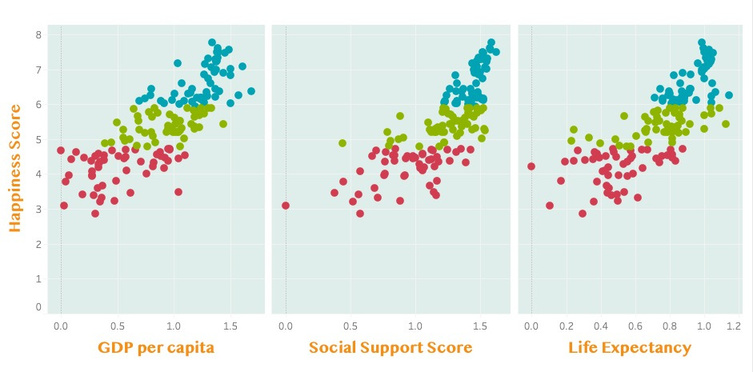
This analysis of the World Happiness Report 2019 is geared toward identifying trends and patterns in happiness scores, examining regional disparities, assessing correlations with various factors, conducting cluster analysis, and effectively communicating insights.
Toolkit
In Python, regression analysis was performed using the scikit- learn library to explore relationships between variables. Cluster analysis was executed
by running the k-means algorithm to identify patterns in the data. Time-series analysis involved running the Dickey- Fuller test to assess stationarity.
Dataset
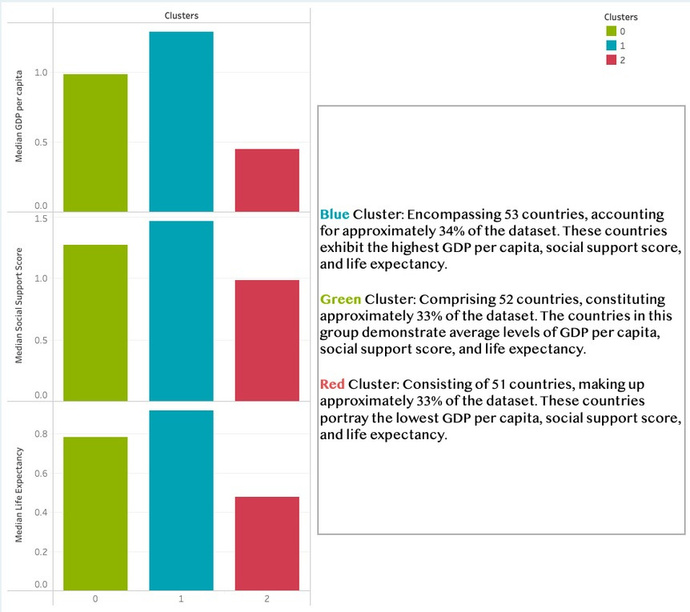
Results
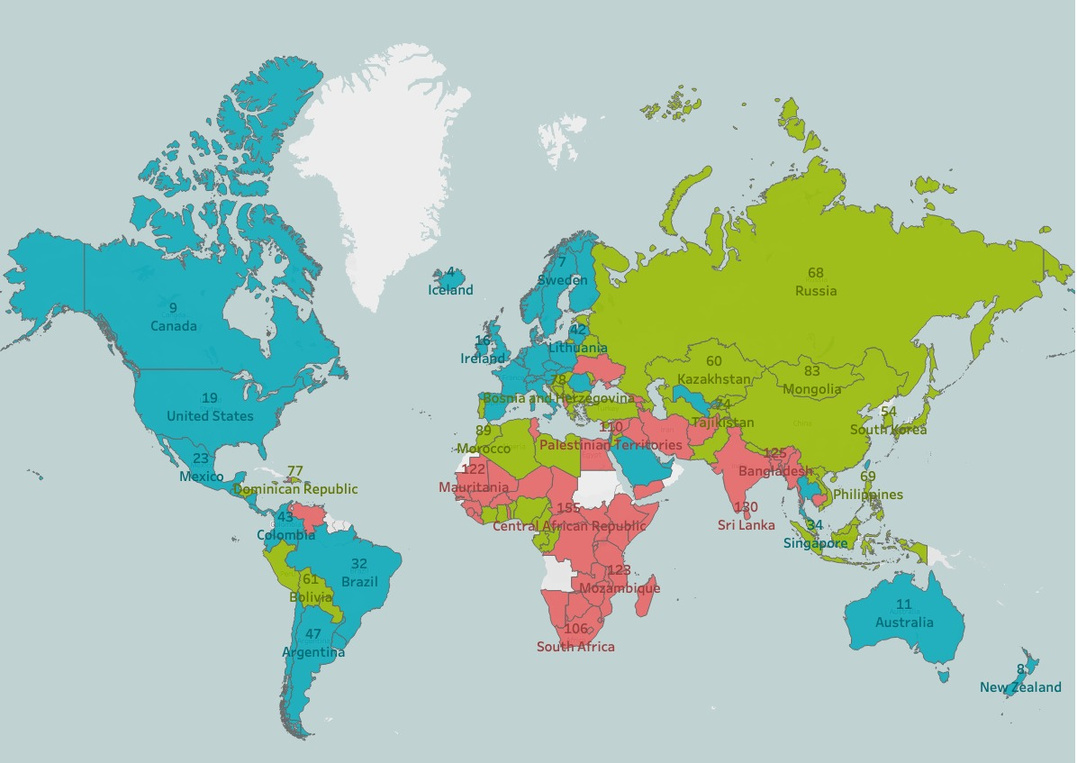
The blue cluster, comprising the most prosperous countries, predominantly includes nations from Western Europe, North America, Australia, and New Zealand. Surprisingly, quite a number of countries from South America, as well as Romania in Eastern Europe and Uzbekistan in Central Asia, were also found within this cluster.
The green cluster represents a more dispersed group of countries ranging from Russia and China to North and West Africa, and from Central to South America.
In contrast, the least prosperous cluster (red) encompasses much of the Middle East and Africa but also includes regions further away, such as Venezuela, Albania, and Ukraine. These insights suggest that while socio-economic factors reliably predict happiness scores, they do not account for the entire picture. Therefore, a comprehensive analysis should also consider factors with weaker correlations with happiness, such as generosity and perceptions of corruption.
Limitations

Subjectivity of Data: The happiness scores are inherently subjective, reflecting individual perceptions and cultural nuances that may not fully capture the complexities of well- being.
Data Availability: Limited data availability and quality across certain regions may introduce biases and limitations in the analysis, potentially skewing the results.
